CX VERSION 1.83
ENHANCEMENTS
The following system-wide enhancements have been made to ConcentrixCX to improve the user experience. These require configuration & coordination with your ConcentrixCX implementation & deployment teams.
Project Health: We are excited to announce the release of Project Health in ConcentrixCX — a new, integrated experience designed to give you a centralized, real-time view of your program’s survey deployment performance and health. Project Health brings together key metrics, reporting, and survey deployment data into a single, intuitive interface directly available within your ConcentrixCX project. This new feature makes it easier than ever to monitor performance, validate outcomes, and drive faster, data-informed decisions without relying on separate tools or manual reporting. Built on proven sample reporting capabilities and seamlessly embedded within the CX platform, Project Health empowers your team with greater visibility, efficiency, and confidence in managing your customer experience programs at scale. Look for more information soon on how this exciting new feature can be deployed on your programs!
Dashboard Builder 2.0: We have made the following enhancements & updates to the Dashboard Builder 2.0 workflow:
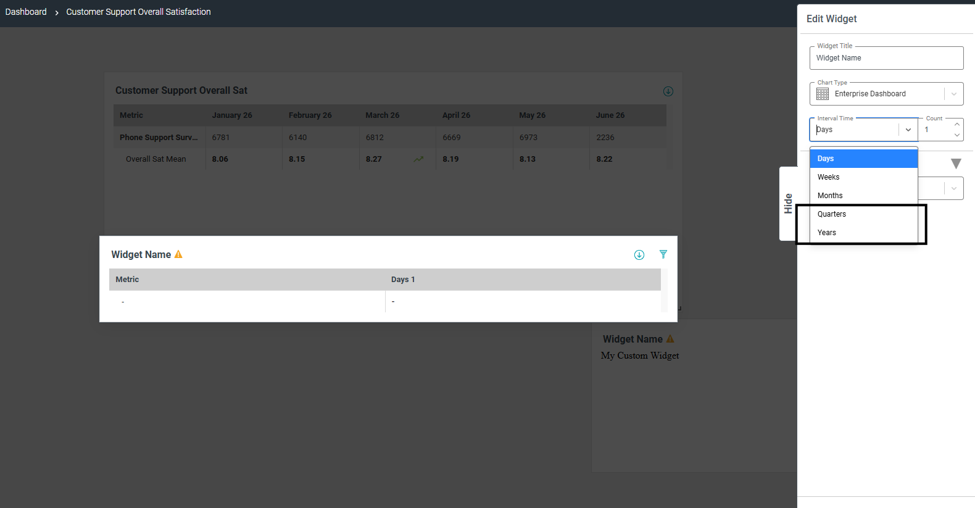
- The trending option now includes quarters & years as options, in addition to days, weeks and months:
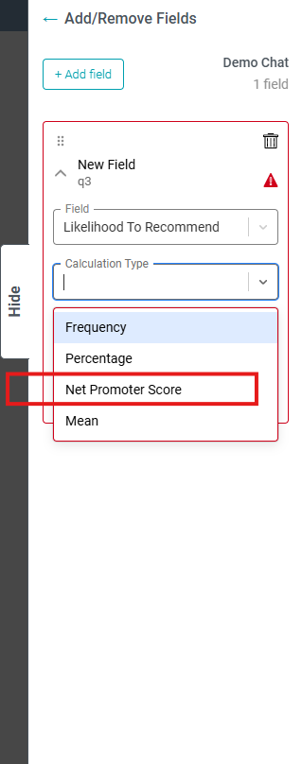
For any Likelihood to Recommend data attribute, you can now calculate Net Promoter Score if needed:
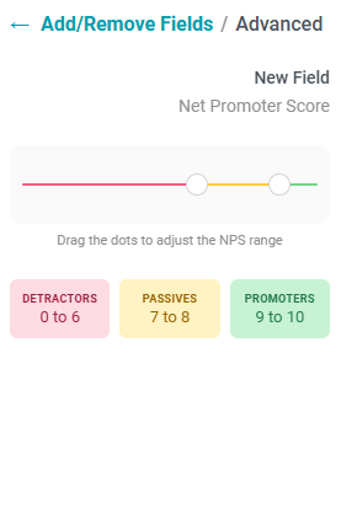
- You can re-define your NPS groups if need be, but the default 0-6, 7-8 and 9-10 segments will be set when you go into Advanced Settings under this calculation type
- If stat-testing is enabled, the proper formula will be executed based on the special case of the Net Promoter Score calculation
The ability to copy a widget/dashboard has been enabled for dashboards that have an enterprise metric or custom metric widget.
Chart Sorting in Metrics Reports: There is now a configuration option in Metrics reports to turn off the default sorting that is applied when switching from the table view to the chart view. The default option remains having sorting turned on within the chart view – see your deployment specialist if this is something you would want to turn off for a given metrics report on your project.
BUGS
The following bugs have been resolved. These do not require any configuration.
Dashboard Builder Transfer Ownership Link: Within the Dashboard Builder view, if a dashboard owner transferred ownership to another CX user, the link in the notification to that user redirected to the Dashboard Builder view, not the dashboard itself. This has been resolved, and the link will now take the user to the dashboard they were given ownership of.
Metrics View Download: When users downloaded a metrics view into Excel and chose the .csv format, if any column within the header of the view contained a comma, the layout of the .csv file would not be formatted properly. This has been fixed, and the layout of a metrics view download will now appear properly in Excel for all file-type formats.
Dashboard Builder Calculation over Time Chart Type: Metrics displayed in the Calculation over Time chart type in Dashboard Builder were not showing the percentage sign if viewing the chart as a line graph. This has been addressed, and the percentage sign will display regardless of the method viewing the chart.
Smart Summaries – Summary Not Loading: Users reported that the smart summaries feature would intermittently just spin or not load the summary after clicking in the generate button. This has been resolved, and the summary will now display consistently for all users and projects where this is enabled.