CX VERSION 1.81
ENHANCEMENTS
The following system-wide enhancements have been made to ConcentrixCX to improve the user experience. These require configuration & coordination with your ConcentrixCX implementation & deployment teams.
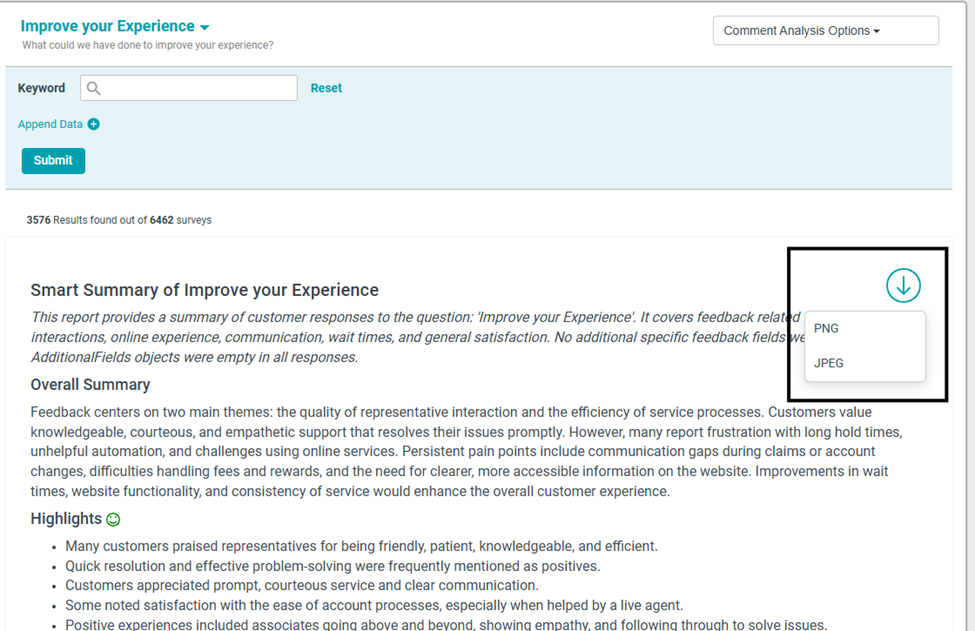
- Smart Summary in Comments View: For programs who have configured the Smart Summaries feature, there is now an option to download the summary as a PNG or JPG file, so that users can pull the summary into external reporting, communication, etc.
The following system-wide enhancements have been made to ConcentrixCX to improve the user experience. These do not require any configuration.
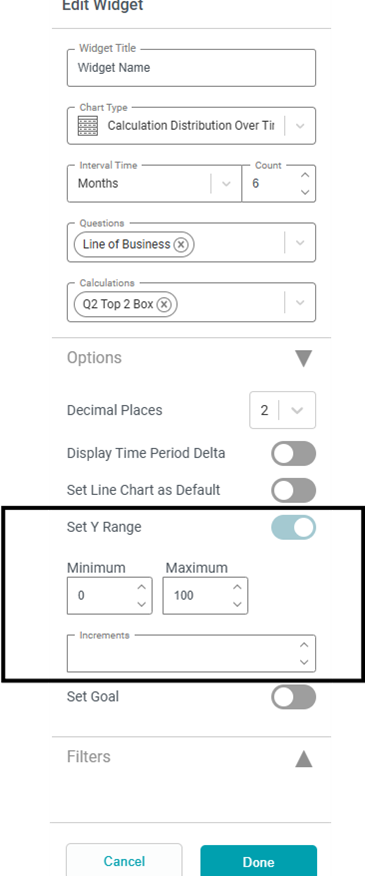
- Dashboard Builder - Calculation Distribution Over Time Data Grid- Line Chart: We have added two options to this chart type that were previously available in the grouped bar/line chart widget type only, for line chart visuals:
- Users now can configure the min/max values of the Y-axis to allow for more precision in viewing the line chart:
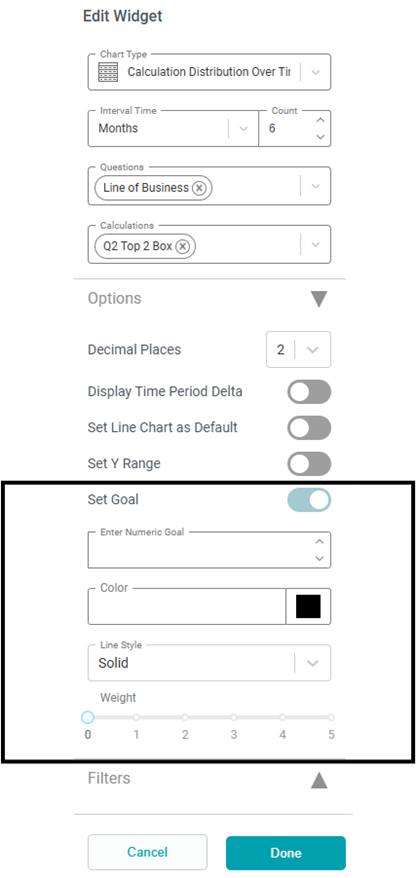
- Users can also now set a goal line for the line chart if needed:
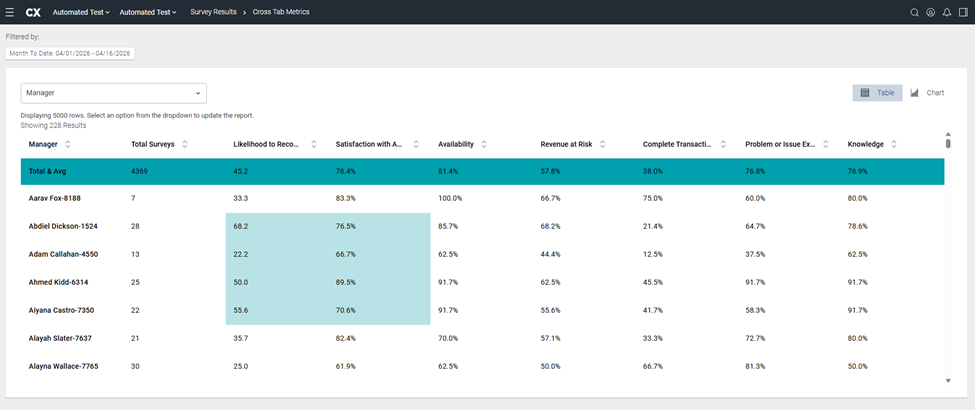
- Metrics Report – Copy & Paste Functionality + Gridline: The ability to highlight & copy/paste cells from a Metrics report into an Excel file has been restored to work in the same manner as that of the original, “CX1” view.
- When users highlight the grid now, it will display in the following fashion:
- Use your keyboard shortcut (CTRL+C) to copy the information. In Excel, when you paste (either via a keyboard shortcut of CTRL+V or right-click then selecting paste), the information will display as follows:
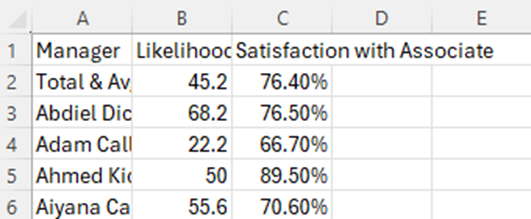
- The following will always be included in the copy/paste function, regardless of if the row was highlighted or not – all column headers, the total & average row, and the first column’s text for that row.
- Additionally, we have added gridlines to the view automatically to help users easily delineate rows & columns visually:
- When users highlight the grid now, it will display in the following fashion:
BUGS
The following bugs have been resolved. These do not require any configuration.
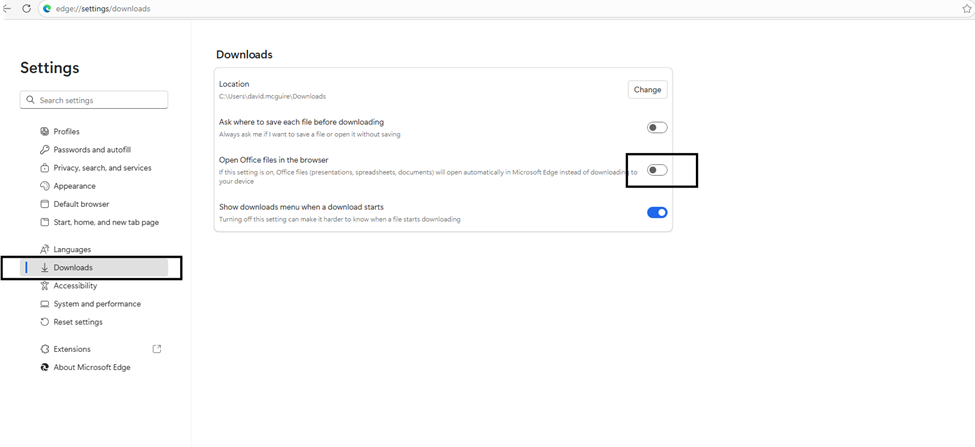
Issue with Data Export .xlsx Downloads: Some users were experiencing issues with attempting to download exports as .xlsx files if available in a Microsoft Edge browser session. The root cause was a browser setting for downloads being turned on – a screenshot is below of the area users can navigate to in order to resolve this issue – make sure the Open Office files in the browser is toggled off:
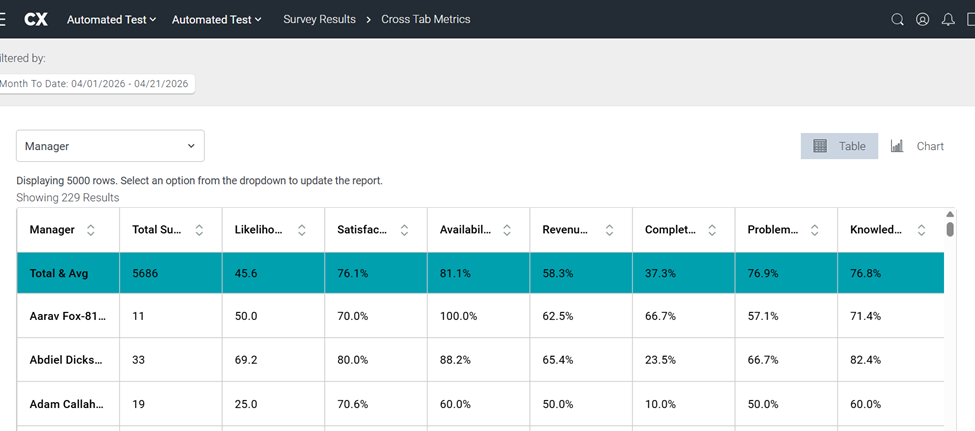
Metrics Views – Sorting Issues: When users toggled back and forth between the table & chart views of a metrics report, the Total & Avg row would end up being placed at the bottom of the chart view. This has been fixed, and the Total & Avg row will remain fixed at the top for all areas within a Metrics report.
Dashboard Builder – Dashboard Editing: Users who had view-only rights on a dashboard were able to edit dashboards as well, which is not allowed – only dashboard owners can edit a dashboard. This has been resolved, and view-only vs edit restrictions now work as intended.