CX VERSION 1.52
ENHANCEMENTS
The following system-wide enhancements have been made to ConcentrixCX to enhance the user experience. These do not require any configuration.
Dashboard Builder – Decimal Place Option: For specific chart types, users will now have the option to specify their preference for how many decimal places the selected calculation will go out to.
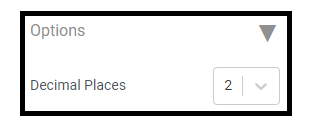
Users will have the option to show calculations out to 0, 1 or 2 decimal places. The default will be 2. The chart types that will include this option are as follows:
- Bullet Chart
- Doughnut Chart
- Data Grid Charts
- Grouped Bar/Line Chart
- Vertical Bar Chart
- Horizontal Bar Chart
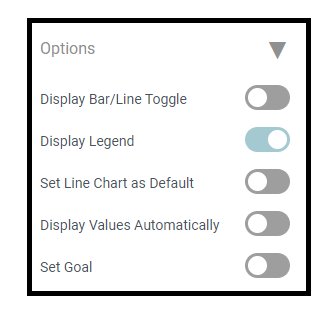
Additionally, the Options area within the widget toolbox will now default to having all inputs minimized, when a widget is created for the first time, or if a previously built widget is being edited. Simply click on the arrow highlighted below to expand this section of the widget toolbox.
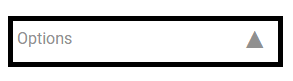
When all options are hidden, the area will render in this manner:
When all options are shown, the area will render in this manner:
Share/Schedule – Attachment is now in PDF Format: For all views that have the share/schedule option available, it will now send the attachment in PDF format versus the original PNG format.
Manage Alerts Screen – Cache Refresh: For programs that utilize the closed-loop alert management process, the manage alerts screen will now refresh immediately when changes are made to a record (owner reassignment, disposition updates, etc.). Previously, there was a delay up to 15 minutes before these changes would reflect in the CX UI.
BUGS
The following bugs have been resolved. These do not require any configuration.
- Usage Reports – Line Chart & User Count Not Updating: For some clients, the line chart & user-count grid within Usage Reports was not rendering properly. This has been resolved, and all areas of the view will now function properly, for all clients.
- Dashboard Builder – Overlapping Text: For the Calculation Distribution and Calculation Distribution over Time chart types, there were instances where the response text in the first column would overlap with other rows. This has been corrected, and all cells will now show response text with no overlap.
- Dashboard Builder – Calculation Distribution over Time: For the Calculation Distribution over Time chart type, for certain questions, it would display rows that did not have any data for the specified time period. This has been updated so that now, only rows with data for at least one of the time periods specified will appear in the chart.