CX VERSION 1.51
ENHANCEMENTS
The following system-wide enhancements have been made to ConcentrixCX to enhance the user experience. These do not require any configuration.
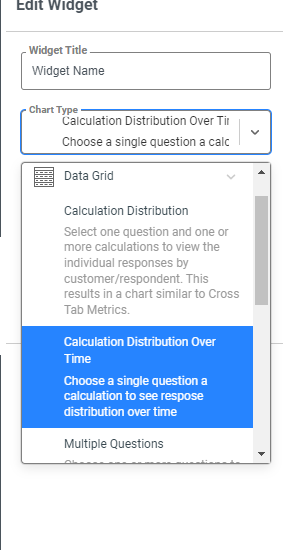
Dashboard Builder – New Datagrid Chart Type: There is a new chart type within the Datagrid Chart set – Calculation Distribution Over Time. This chart type gives users the ability to trend a single, pre- configured calculation by all available questions in the dashboard builder widget toolbox.
Users can find this new chart type in the aforementioned datagrid chart area
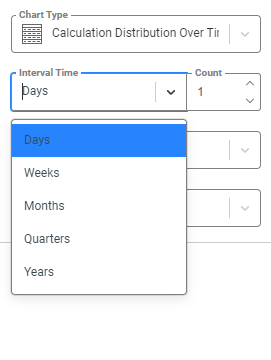
Users will have the same time-period options available that they do in other chart types that have trending options:
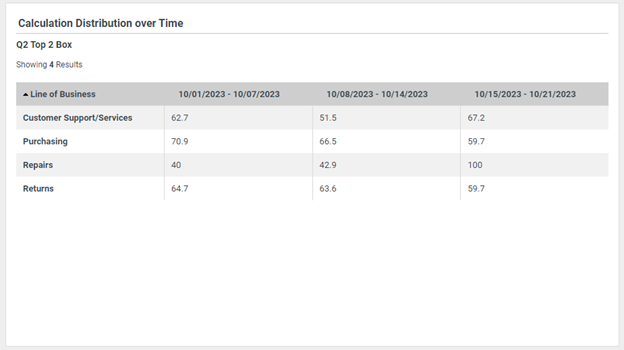
After users input the selected time period interval and number of periods to show, they can select a single question and calculation, and then the report will display the desired trending chart:
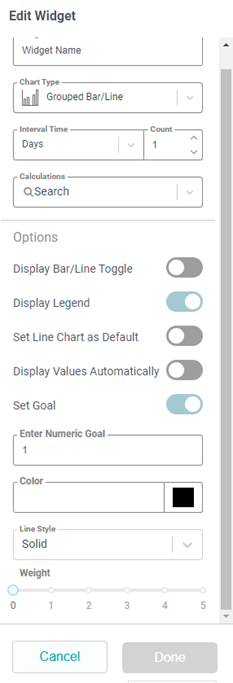
Dashboard Builder – Goal-Based Reporting: For the chart types with the Set Goal option, if that option is selected by a user, it will now include a scroll bar so that the inputs are more legible for the user as they make their selections related to this option:
Metrics View – Increase Maximum Number of Elements Shown: For all metrics views on a program, they will now display up to 5,000 individual responses/values within a specific data element. Previously, this limit was 1,000.
BUGS
The following bugs have been resolved. These do not require any configuration.
- Dashboard Builder – Sharing via E-Mail: When dashboards were shared with users via e-mail, and the dashboard visual included a datagrid chart type or filter applied, this would cause the attachment sent out to be blank. This has been fixed, and the entire dashboard visual will now be sent out properly via e-mail.
- Alternate Calendars – Issue in YTD Dashboards: For certain customers who utilize the alternate calendar functionality in CX, there was an issue with a specific vertical bar widget within YTD dashboards where it would not render properly. This has been fixed and will now display properly for all.
- Usage Reports – YTD Quick-Date Button: When the YTD quick-date button was selected within the Usage Reports view, the legend would not properly render the months included in this filter. This has been corrected, and all displays properly now within the legend when this option is chosen in Usage Reports.